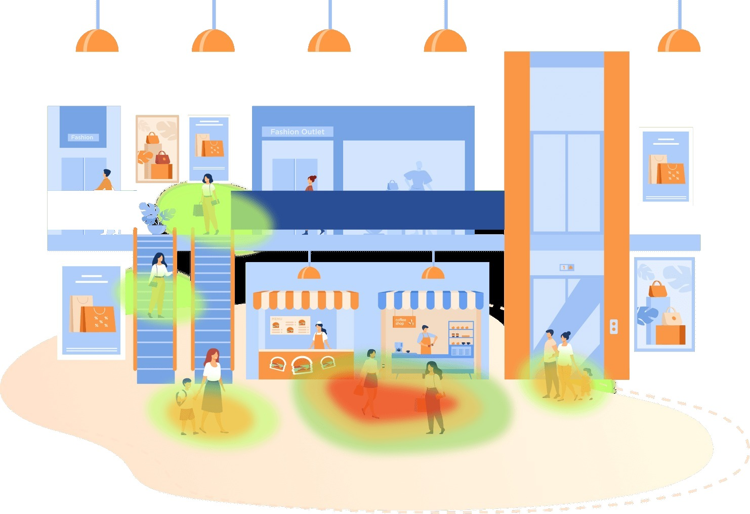
Walk into two branches of the same retailer: floor plans may be identical, yet heatmap reports can differ significantly. One store may define a display zone around a single fixture; another may include the adjacent aisle. Such variation often stems from inconsistent zone setup—not shopper behavior.
For retailers using retail heatmap data across multiple locations, consistent zone definitions create a clearer basis for interpreting dwell time, traffic flow, and customer engagement.
Why Do Measurement Zones Matter in Retail Heatmap Analysis?
A measurement zone gives analytical data a physical meaning. Without a clear definition, a report may show that shoppers spent more time in one area without indicating whether the difference came from actual behavior or from a larger measurement boundary.
The official OVOPARK heatmap solution describes heatmap analysis in terms of customer stay time at points of interest such as shelves, shopping-mall districts, and advertisements. The company also connects this analysis with store-layout optimization and product placement.
A Clear Business Purpose
Each zone should represent a recognizable retail function. Examples include an entrance, product category, promotional display, checkout area, or specific shelf section.
Defining the purpose first gives each measurement area a clear role in reporting. An entrance zone may support traffic analysis, while a promotional-display zone can be used to examine customer engagement. The important point is to state what the zone represents before collecting and comparing its data.
A Stable Physical Boundary
Physical fixtures—like shelving, walls, aisles, counters, and department boundaries—make reliable zone references. Temporary displays are less stable.
Seasonal campaigns add complexity: promotional stands often relocate monthly. Zones anchored to permanent or stable features are easier to maintain across reporting periods. Note any major store environment changes in the zone documentation.
How Should Different Areas Be Represented Across Stores?
Cross-store analysis requires more than giving every area a name. Zones should represent comparable business functions and contain enough physical context for analysts to understand what the data describes.
Similar Purpose and Reasonable Scale
Zones representing the same retail function should have broadly comparable purposes. A large open department and a narrow product bay should not automatically be treated as equivalent simply because both are labeled “product area.”
Identical dimensions are not always practical because store footprints differ. A better reference is the zone’s business purpose, approximate scale, and physical boundaries. Recording those characteristics alongside the zone name makes later comparisons easier to interpret.
Consistent Naming and Documentation
Zone names should follow a shared structure across locations. A code can combine the store identifier, department, area type, and sequence number. For example, “ST01-Fashion-A03” provides more context than a temporary label such as “Hot Zone.”
Keep the zone map, purpose, boundaries, and measurement rules together in the project documentation. A standardized record also gives analysts a reference when they need to investigate an unusual result or review older reports.
Where Do People Counting Analytics Fit Into the Measurement Framework?
Heatmaps provide spatial context, while people counting analytics can add a broader view of movement and customer behavior. These datasets work better together when each measurement has a clearly defined role.
A passage area may represent traffic, while a product section may focus on dwell time or engagement. Keeping those purposes distinct makes it easier to understand what each metric is measuring when several datasets appear in the same report.
The OVOPARK Analytics platform includes traffic analysis, dwell time and product engagement time, heatmap analysis, and store KPI analysis. Its reporting covers multiple time periods and supports multi-location comparison.
How Can Retailers Keep Zone Definitions Useful Over Time?
Measurement zones may need review as stores evolve through fixture changes, department adjustments, seasonal campaigns, or renovations. Those changes can alter how shoppers move through a space and may affect the meaning of an existing zone.
Rather than rebuilding the entire measurement model whenever a layout changes, review the affected areas and determine whether their original purpose and boundaries still apply. For substantial changes, preserve the earlier zone definition in the reporting record and establish the new boundary from the date of the change.
This distinction is particularly relevant to long-term reporting. Analysts can then tell whether a change in heatmap activity reflects shopper behavior, a new store configuration, or both.
Applying a Consistent Zone Model With the Analytics Platform
OVOPARK describes its platform as an AI-driven retail technology solution covering customer footfall, dwell time, store heatmaps, and store-performance management. Its solutions are positioned for retail stores, shopping malls, events, exhibitions, and other public spaces.
For retailers evaluating a heatmap solution, this broader platform approach can be useful when spatial analysis needs to sit alongside traffic and store-performance information. The analytical foundation still begins with clear measurement areas that correspond to the retailer’s actual floor plan and reporting objectives.
A Practical Framework for Cross-Store Heatmap Reporting
A consistent zone model rests on six elements: business purpose, physical boundary, reasonable scale, naming convention, documentation, and change history. Together, they provide a common reference for discussing areas of interest and analyzing cross-location customer behavior—and support people-counting analytics by distinguishing traffic zones from engagement or dwell-time zones.
For retailers using heatmap data, thoughtful zone design turns visual reports into structured operational insights. As stores and layouts evolve, maintaining consistent definitions—or clearly documenting approved changes—ensures long-term reporting clarity.
